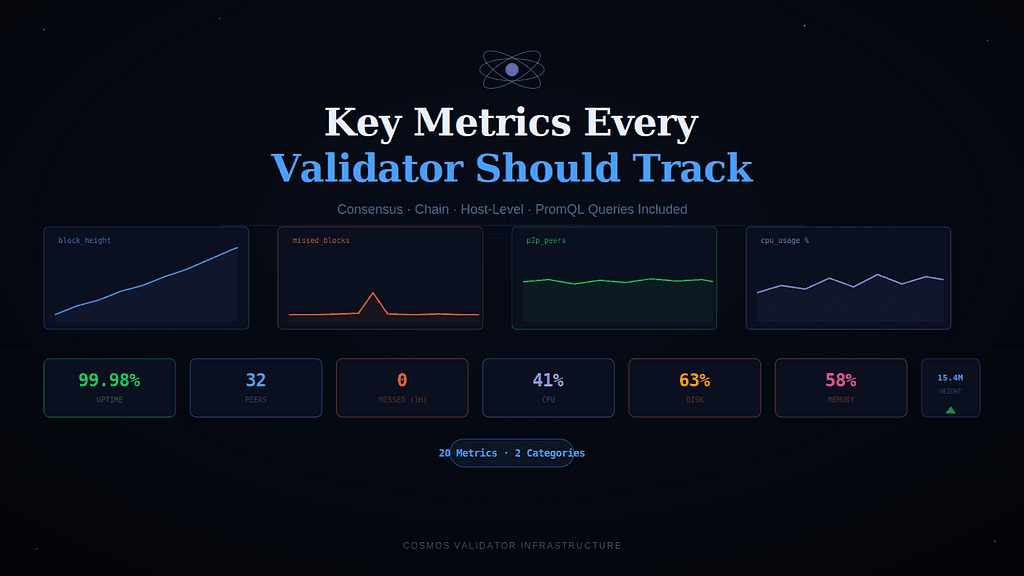
What to watch, what it means, and when to act — with PromQL queries you can use today
Why Metrics Are Not Just For Engineers
Running a validator without metrics is like flying a plane without instruments. Everything feels fine until it doesn’t — and by the time you notice, you may already be jailed.
Metrics give you three things: visibility into what’s happening right now, history to understand trends, and early warning before problems become incidents. A missed block alert at 2 AM is annoying. Waking up to find you’ve been jailed for downtime is a delegator conversation you don’t want to have.
This guide covers every metric a Cosmos validator operator should be tracking — broken into two categories: consensus and chain metrics (from CometBFT and the Cosmos SDK) and host-level metrics (from node_exporter). For each metric, you’ll get the PromQL query, what normal looks like, and when to fire an alert.
Prerequisites
This guide assumes:
- Your node has prometheus = true set in config.toml and is exposing metrics on port 26660
- node_exporter is running on port 9100
- Prometheus is scraping both endpoints
- Grafana is connected to Prometheus
If not, set that up first — the previous post in this series covers the full stack installation.
Category 1: Consensus & Chain Metrics
These come from your gaiad process via the CometBFT and Cosmos SDK instrumentation layer.
1. Block Height
What it is: The current height of the blockchain as seen by your node.
Why it matters: Block height should be continuously increasing. A stalled height means your node has stopped processing blocks — either it’s stuck in consensus, lost peers, or the process has hung.
cometbft_consensus_height
What normal looks like: Steadily increasing, roughly one new block every 6–7 seconds on most Cosmos chains.
Alert on: Height not increasing for more than 60 seconds.
# Alert: height hasn't changed in 1 minute
increase(cometbft_consensus_height[1m]) == 0
2. Validator Missing Blocks (Missed Signatures)
What it is: The number of blocks your validator has failed to sign within the current slashing window.
Why it matters: This is your most critical validator-specific metric. Cosmos chains slash for downtime when you miss more than a threshold percentage of blocks in a sliding window (typically 5% of 10,000 blocks = 500 missed). You want to know when this number starts climbing — not after you’ve been jailed.
cometbft_consensus_validator_missed_blocks
What normal looks like: Zero, or very close to zero. Occasional single misses are normal during high network load.
Alert on: Any increase in missed blocks is worth a warning. A rapid increase is critical.
# Warning: any missed blocks in the last 5 minutes
increase(cometbft_consensus_validator_missed_blocks[5m]) > 0
# Critical: more than 10 missed in 10 minutes
increase(cometbft_consensus_validator_missed_blocks[10m]) > 10
3. Validator Rank / Voting Power
What it is: Your validator’s current voting power in the active set.
Why it matters: A sudden drop in voting power can indicate delegators unbonding. Reaching zero means you’ve fallen out of the active set — you’re no longer signing blocks and earning rewards.
cometbft_consensus_validators_power
What normal looks like: Stable, matching your expected bonded stake.
Alert on: Significant drop (more than 5%) over a short period.
# Warning: voting power dropped more than 5% in 1 hour
(cometbft_consensus_validators_power - cometbft_consensus_validators_power offset 1h)
  / cometbft_consensus_validators_power offset 1h * 100 < -5
4. Connected Peers
What it is: The number of peers your node is currently connected to.
Why it matters: Peers are how your node receives new blocks and broadcasts its signatures. Too few peers means you’re at risk of losing sync. Zero peers means your node is completely isolated and will start missing blocks immediately.
cometbft_p2p_peers
What normal looks like: 20–50 peers for a healthy validator. Never below 10.
Alert on:
# Warning: fewer than 10 peers
cometbft_p2p_peers < 10
# Critical: fewer than 5 peers
cometbft_p2p_peers < 5
5. Fast Sync Status (Catching Up)
What it is: A boolean flag — 1 means your node is in fast sync (catching up to chain tip), 0 means it's fully synced and participating in consensus.
Why it matters: A node that’s catching up is not signing blocks. If this stays at 1 for more than a few minutes, you have a problem.
cometbft_consensus_fast_syncing
What normal looks like: 0 — permanently. Any value of 1 is an active incident.
Alert on:
# Critical: node has been catching up for more than 5 minutes
cometbft_consensus_fast_syncing == 1
6. Block Interval (Consensus Round Time)
What it is: The time between consecutive blocks. Measures how fast the network is finalizing consensus.
Why it matters: A sudden spike in block interval means the network is struggling — either low validator participation, network partitions, or high load. It can also signal your node is slow to process blocks.
rate(cometbft_consensus_block_interval_seconds_sum[5m])
  / rate(cometbft_consensus_block_interval_seconds_count[5m])
What normal looks like: 6–7 seconds on most Cosmos chains.
Alert on: Consistently above 15 seconds for more than 5 minutes.
7. Consensus Rounds
What it is: The number of consensus rounds needed to finalize a block. Normally, a block is finalized in round 0. Higher rounds mean validators couldn’t agree quickly.
Why it matters: Persistent high round numbers indicate network instability — low peer count, slow validators, or a network incident. It can also cause your validator to miss votes if it’s slow to respond.
promql
cometbft_consensus_rounds
What normal looks like: Stays at 0 for the vast majority of blocks.
Alert on: Any sustained period (5+ minutes) of non-zero round numbers.
8. Mempool Size
What it is: The number of unconfirmed transactions waiting in your node’s mempool.
Why it matters: A growing mempool means transaction throughput isn’t keeping up with incoming transactions. Very large mempools (10,000+ transactions) can cause memory pressure and slow block processing.
cometbft_mempool_size
What normal looks like: Under 1,000. Spikes during high-activity periods are normal.
Alert on: Consistently above 5,000 for more than 10 minutes.
9. Mempool Bytes
What it is: Total size of transactions in your mempool in bytes.
Why it matters: Complements mempool size — a few large transactions can cause the same memory pressure as thousands of small ones.
cometbft_mempool_size_bytes
Alert on: Approaching your configured max_txs_bytes limit in config.toml.
10. RPC Connections
What it is: Number of active connections to your node’s RPC endpoint.
Why it matters: If you’re running an RPC node alongside your validator (not recommended, but common), high connection counts indicate heavy load that could affect block signing.
cometbft_rpc_connections
Alert on: Above 50 on a validator node — if you see this, you likely need to separate your RPC from your signing node.
Category 2: Host-Level Metrics
These come from node_exporter and cover the underlying Ubuntu server your validator runs on. Infrastructure problems cause validator problems — catching them early is the difference between a warning alert and a slashing event.
11. CPU Usage
What it is: Percentage of CPU time being used across all cores.
Why it matters: Sustained high CPU (90%+) can slow block processing and cause your validator to fall behind in consensus rounds, leading to missed blocks.
100 - (avg by(instance)(rate(node_cpu_seconds_total{mode="idle"}[5m])) * 100)What normal looks like: 20–60% under normal operation. Spikes during upgrade blocks are normal.
Alert on:
# Warning: CPU above 80% for 10 minutes
100 - (avg by(instance)(rate(node_cpu_seconds_total{mode="idle"}[5m])) * 100) > 80
# Critical: CPU above 95% for 5 minutes
100 - (avg by(instance)(rate(node_cpu_seconds_total{mode="idle"}[5m])) * 100) > 95
12. Memory Usage
What it is: Percentage of RAM currently in use.
Why it matters: Cosmos nodes are memory-hungry. When RAM is exhausted, the OS starts swapping to disk — which is catastrophically slow for a blockchain node. An OOM kill of your gaiad process will cause immediate missed blocks.
promql
(1 - (node_memory_MemAvailable_bytes / node_memory_MemTotal_bytes)) * 100
What normal looks like: 50–75% on a well-sized server.
Alert on:
# Warning: memory above 80%
(1 - (node_memory_MemAvailable_bytes / node_memory_MemTotal_bytes)) * 100 > 80
# Critical: memory above 92%
(1 - (node_memory_MemAvailable_bytes / node_memory_MemTotal_bytes)) * 100 > 92
13. Disk Usage
What it is: Percentage of disk space used on your root or data partition.
Why it matters: A full disk is an immediate node killer. When disk fills up, your node can’t write new blocks, state, or logs — it halts. There is no graceful degradation. This is one of the most common causes of unexpected validator downtime.
(1 - (node_filesystem_avail_bytes{mountpoint="/"}
  / node_filesystem_size_bytes{mountpoint="/"})) * 100
What normal looks like: Under 70% with room to grow.
Alert on:
# Warning: disk above 75%
(1 - (node_filesystem_avail_bytes{mountpoint="/"}
  / node_filesystem_size_bytes{mountpoint="/"})) * 100 > 75
# Critical: disk above 90%
(1 - (node_filesystem_avail_bytes{mountpoint="/"}
  / node_filesystem_size_bytes{mountpoint="/"})) * 100 > 90
14. Disk Growth Rate
What it is: How fast your disk is filling up, measured over a rolling window.
Why it matters: Disk usage alone doesn’t tell you when you’ll run out. Disk growth rate tells you whether you have 3 months or 3 days before you hit capacity. Essential for capacity planning — especially on archive nodes.
# Bytes per hour consumed on root partition
rate(node_filesystem_size_bytes{mountpoint="/"}[1h]) -
rate(node_filesystem_avail_bytes{mountpoint="/"}[1h])
What to do with it: Project time to full disk:
# Hours until disk full at current growth rate
node_filesystem_avail_bytes{mountpoint="/"}
  / (rate(node_filesystem_size_bytes{mountpoint="/"}[6h])
  - rate(node_filesystem_avail_bytes{mountpoint="/"}[6h]))
  / 3600
Alert on: Projected full disk within 72 hours.
15. Disk I/O Utilization
What it is: Percentage of time the disk is busy with read/write operations.
Why it matters: High disk I/O (above 90%) causes read/write latency that can slow block processing. This is especially common during state sync, snapshot creation, or when running on spinning disks (HDDs) instead of NVMe SSDs.
rate(node_disk_io_time_seconds_total{device="sda"}[5m]) * 100Replace sda with your actual device name (nvme0n1 for NVMe SSDs).
Alert on: Consistently above 85% for more than 5 minutes.
16. Network Bandwidth (Inbound/Outbound)
What it is: Bytes per second received and transmitted on your primary network interface.
Why it matters: Unusually high inbound traffic may indicate a DDoS or a peer flooding your node. Low outbound during normal operation may indicate peer connectivity issues.
# Inbound (bytes/sec)
rate(node_network_receive_bytes_total{device="eth0"}[5m])
# Outbound (bytes/sec)
rate(node_network_transmit_bytes_total{device="eth0"}[5m])
Replace eth0 with your actual interface name (ens3, ens5, etc.).
What normal looks like: 1–10 MB/s each direction for a typical validator with 30–50 peers.
Alert on: Sustained inbound above 100 MB/s (possible DDoS or peer flood).
17. System Load Average
What it is: Average number of processes in the run queue over 1, 5, and 15 minute windows.
Why it matters: Load average above the number of CPU cores means processes are waiting for CPU time. A load of 16 on a 4-core machine means severe CPU contention.
# 1 minute load average
node_load1
# 5 minute load average
node_load5
# 15 minute load average
node_load15
What normal looks like: Below the number of CPU cores on your server.
Alert on:
# Load average above 2x CPU core count
node_load5 > 2 * count(node_cpu_seconds_total{mode="idle"}) without(cpu, mode)
18. Process Up (Gaiad Running)
What it is: Whether the gaiad process is running at all.
Why it matters: This is your most basic health check. If gaiad isn't running, nothing else matters. This should be the first alert that fires, before any consensus metrics.
# 0 = down, 1 = up
up{job="cosmos_node"}
Alert on:
up{job="cosmos_node"} == 0Fire this with a 1-minute for clause — don't wait longer. Every minute your node is down, you're missing blocks.
19. Open File Descriptors
What it is: Number of file descriptors currently open by the system or by gaiad.
Why it matters: Cosmos nodes open a large number of files — database handles, network connections, log files. Hitting the system limit (ulimit) causes the process to fail to open new connections or write to disk, leading to crashes or missed blocks.
# System-wide open file descriptors
node_filefd_allocated
# As a percentage of the system limit
node_filefd_allocated / node_filefd_maximum * 100
Alert on: Above 80% of the system maximum.
20. System Uptime
What it is: How long the server has been running since last boot.
Why it matters: Unexpected reboots are a common cause of downtime events. A sudden reset in uptime means your server rebooted — possibly from an OOM kill, kernel panic, or cloud provider maintenance.
node_time_seconds - node_boot_time_seconds
Alert on: Any sudden decrease in uptime (reboot detected).
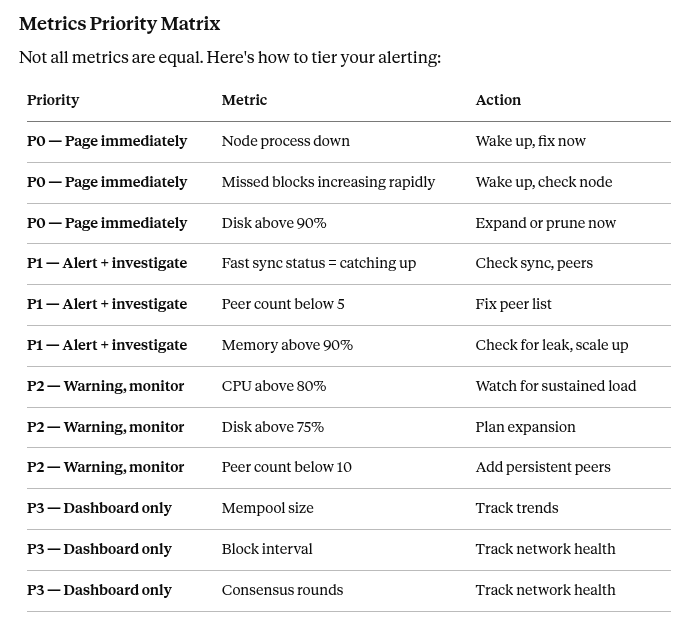
Building Your Dashboard: Five Panels You Need
If you’re building a Grafana dashboard from scratch, start with these five panels and everything else is refinement:
Panel 1: Node Status (Stat panel) up{job="cosmos_node"} — Green/Red. This is the first thing your eyes should go to.
Panel 2: Missed Blocks (Time series) increase(cometbft_consensus_validator_missed_blocks[1h]) — Should be flat at zero.
Panel 3: Peer Count (Time series) cometbft_p2p_peers — With threshold lines at 10 (warning) and 5 (critical).
Panel 4: Resource Usage (Multi-stat) CPU %, Memory %, Disk % — Side by side with color thresholds.
Panel 5: Block Height (Time series) cometbft_consensus_height — Should be a consistent upward slope.
These five panels answer the five questions that matter at 3 AM: Is my node up? Am I signing blocks? Am I connected? Is my server healthy? Is the chain moving?
Summary
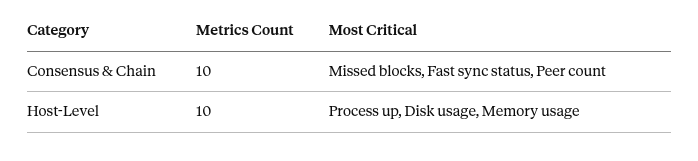
Twenty metrics sounds like a lot. In practice, your alerting will only fire on 3–4 of them regularly — mostly disk growth, occasional peer drops, and CPU spikes during upgrade blocks. The rest sit quietly in your dashboard, giving you context when something does go wrong.
The goal isn’t to watch all twenty metrics constantly. It’s to have them instrumented so that when an incident happens, you spend five minutes diagnosing instead of five hours guessing.
Key Metrics Every Validator Operator Should Track was originally published in Vitwit on Medium, where people are continuing the conversation by highlighting and responding to this story.